
Introduction
Netflix is available in 190 countries. The benefits it offers – more than 5000 titles, available on click of a button, on a device your preference, in the best possible resolution. It is the same across the world, still a user in India pays ₹ 799 a month, in US it’s $ 19.5 (₹ 1440), Germany € 15.99 (₹ 1420), UK £ 13.99 (₹ 1430) and Brazil R$ 45.9 (₹ 600). Someone in US with $ 20 to spare can either buy a Netflix subscription for a month or instead convert the dollars to rupees and buy almost two months of subscription. The fact that paying in rupees will get you greater value (in form of more number of subscription days) than paying in dollars makes rupee more valuable. Or to put it differently, a customer holding rupees will have power to purchase more goods than another customer with equivalent amount of dollars.
The concept in play here is Purchasing Power Parity (PPP), which means that different currencies have different purchasing power. As per PPP, a currency may be undervalued or overvalued. In the Netflix example, 1 $ is equal to ₹ 40 ( ₹799 / $ 19.5 = ~₹ 40), i.e., . While in reality, it is $ 1 = ₹ 73, which means rupee is undervalued when compared to dollars. But we cannot just say if a currency is overvalued or undervalued based on what Netflix decides to charge its customers. In fact, to calculate purchasing power of different currencies, various measures are tracked and collected, these are known as Penn World Tables and are maintained by the University of Groningen. They keep track of measures like GDP, Spending, Import/ Exports etc of economies across different years.
A unique and light-hearted approach which is simpler to understand is the Big Mac Index maintained by ‘The Economist’. Instead of tracking multiple prices of multiple goods and services globally, it just compares the price of the king of the fast-food restaurants, McDonald’s popular menu item ‘Big Mac’. Why Big Mac? Well for any goods or services to qualify for the purpose of PPP comparison, they should ideally meet two criteria: a) available in most countries, and b) represant item of what people actually spend money on. The Big Mac meets the first criterion quite well and does a pretty good job on the second. The McDonalds and thus, the Big Macs are available across the world with similar ingredients and attracts fast food lovers universally. Similar to Big Mac, the Netflix’s subscription also checks the first criteria and scores good points on the second. In fact, in today’s digital age, most of the digital products have similar characteristics globally and are consumed by major percent of country’s urban population.
Data Preparation and Analysis
Let’s take a basket of goods and services which are popular products in today’s digital age. This basket contains three type of goods.
- Devices: Mobiles, Tablets, Laptops, Play Stations and Xboxes. These devices act as our portal to the digital world. Pick up a device, connect to Wi-Fi, and voila, you are connected to millions worldwide.
- Software: Microsoft Office, Adobe Creative Suits, Gmail, iCloud.After connecting to our devices, we use software to do our work, communicate with people, save our stuff and many other tasks.
- Content: Netflix, Amazon Prime, Spotify, YouTube, Apple Music. This refers to media content (movies, songs, videos etc.) that are used by users. The key difference between Software and Content is Content is dedicated digital consumption, while software has a much broader context to do stuff.
To understand the PPP, we tracked the prices of 14 different products (goods or services, list available at end of post) following under each of the categories in 17 different currencies. Using these prices, we compared the purchasing power of each currency to determine if it’s undervalued or overvalued.
Results
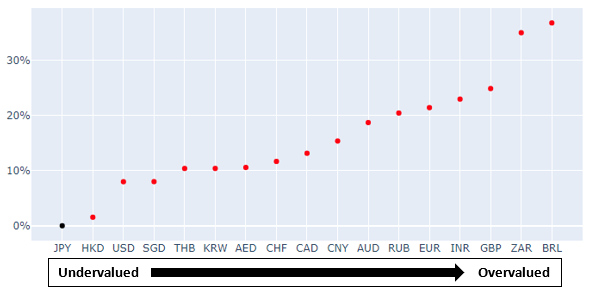
We compared currencies using prices of all three categories in the below chart.
- A basket containing all 14 products will cost ₹ 3,90,000 in India, while same would cost £ 4,121 (~ ₹ 4,16,000) in UK.
- The currencies like Chinese Yuan (CNY), Indian Rupees (INR) and Russian Ruble (RUB) to the left are undervalued in comparison to the other currencies on the X-axis.
- The currencies to right like Great Britain Pound (GBP) and Euro (EUR) are overvalued.
- The percentages represent magnitude of overvaluation. For instance, United Arab Emirates Dirham (AED) being at 20% means it is 20% overvalued (or it should be cheaper by 20%) compared to currencies at 0% say Indian Rupee or Chinese Yuan.

Analysing each category in the basket individually also provides interesting insights.
Devices
A basket of devices’ products (iPhone, MacBook, PS5, Xbox and Samsung Galaxy S21) costs ¥ 4,34,000 (Japanese Yen) in Japan, and R 90,000 (South African rand) in South Africa which is equivalent to ¥ 6,75,000. A comparison across currencies is plotted below:
Observations:
The overall range reduced. Barring two currencies on right, the range is between 0 – 25%. This is because of two factors:
- Devices are manufactured globally and thus, the costs of production for these are almost same irrespective of the location it is sold in. Thus, while selling to customers companies want to charge standard margins across the globe.
- These goods have high value per weighing per unit, and can be transported from one location to anothe easily. If the price difference between two regions is too much, a third party seller might but a bulk of these goods in the cheaper location travel to the expensive location and sell to customers there, making a lot of money during the process.
Software
A basket of software products (Adobe CC, Microsoft 365, Apple iCloud) will cost R$ 546 (Brazilian real) in Brazil, while in Japan it costs ¥ 21,285 (~ R$ 1100). A comparison across currencies is plotted below:
Observations:
- The overall valuation range increased. This is because although goods (software) are centrally developed, the transferability of goods/services is not possible. A customer in Japan who needs a software will have to buy it in same country as distribution is managed locally as per the local laws.
- The prices are higher in developed economies (like Japan, US) as compared to poorer economies (like Russia, China). This is because these are high margin products, and the companies tend to lower their margin in poorer economies to lure customers and charge more to customers in developed economies with high affordability.
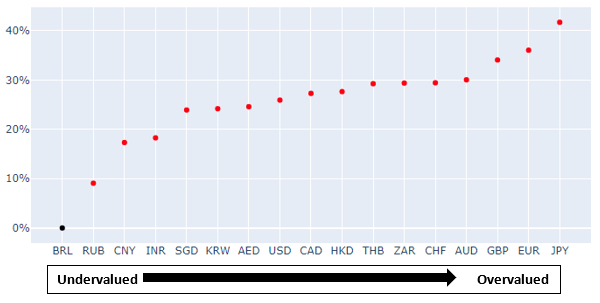
Content
A basket of content products (Netflix, Amazon Prime, Disney +, YouTube Premium, Spotify, Apple Music) costs ₹ 2,774 in India, on the other extreme it costs £ 114 (~ ₹ 11,500) in UK. A comparison across currencies is plotted below:

Observations:
- The overall range increased, now ranging from 0-80%. To put it in another way based on prices of Content services like Netflix, Amazon, Spotify etc, the Great Britain Pound (GBP) is 80% overvalued as compared to Indian Rupee.
- Unlike products or software, a lot of digital content is produced locally. The Netflix and Amazon have production houses in many countries and produce movies/ TV Series in local languages. The budget for movies produced in Bollywood is a lot less than one produced in Hollywood. Such content may be globally but the target audience in most of these cases are local customers. Benefits of these lower costs are passed onto customers by charging lower prices.
- Market forces also brings down the prices. A blockbuster movie in India might attract more eyeballs than a blockbuster in USA, but the former would earn a lot less due to price sensitive customers. Thus, companies must limit the prices they can charge on content.
Summary
PPP dictates that the prices of commodities should be same all over the world. If the prices are different, some currencies are either overvalued or undervalued. But as we saw in our comparison of the prices of different category of products, there might be other reasons for the price’s disparity. Products with high value per weight are prone to be physically traded and are more likely to have similar prices in the countries they are available in. Next, products having same cost of production are more likely to be priced similar, as companies need to recoup their investments. Finally, in products where cost of production is different, companies have more flexibility to vary their prices and thus, there is maximum price disparity among these.
When we think of lower cost of production, we assume that it is due to availability of cheaper labour. The assumption is not entirely correct. The bifurcation of traded cost and non-traded cost has a better explanation. That would be a great idea for a new post 😉
Annexure
- Devices
- iPhone 12 – 64 GB
- Macbook Air – Apple M1 Chip with 8‑Core CPU and 7‑Core GPU 256GB Storage
- Play Station 5 – Disk Version
- XBOX Series X
- Samsung Galaxy S21 Ultra – 5G, 256 GB, 12GB
- Software
- Adobe CC Subscription- Adobe CC All Apps Annual Plan Monthly Payment
- Microsoft 365 Subscription – Microsoft 365 Personal Annual Plan
- Apple iCloud Subscription – 50GB Storage Monthly Plan
- Content
- Netflix – Premium Plan per month
- Amazon Prime – monthly Subscription
- Disney + – Yearly Subscription
- YouTube Premium – YouTube Premium with YT music
- Spotify – Individual plan for 1 month
- Apple Music – Individual for 1 month
Detailed list of products and the prices as collected in February 2021 can be found here: https://cutt.ly/ppp_digital
