

In today’s globalized world, digital products have become an integral part of our lives. Whether it’s a sleek new smartphone, cutting-edge software, or access to your favourite content, the price we pay for these digital goods can vary significantly from one country to another. This phenomenon is often attributed to Purchasing Power Parity (PPP), and our analysis reveals some fascinating insights into how it impacts consumers around the world.
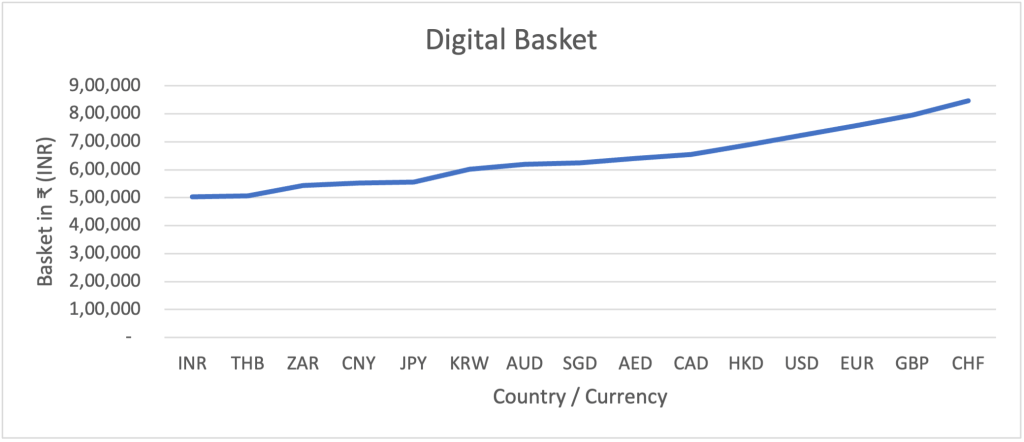
To understand the implications of PPP, we conducted an analysis of digital product prices in 15 different countries and created a basket of 13 products. This basket includes everything from smartphones to software and content subscriptions. In India, this basket would set you back ₹5 lakhs for a three-year period. However, the same basket in Switzerland would cost a staggering ₹8.5 lakhs (or CHF 9.2k) over the same time frame. The products in the most expensive economy are 70% higher than in the cheapest economy.
Factors Contributing to Price Disparity
Price disparity in the context of purchasing power parity can be attributed to two key factors: the cost of production and market pricing.
The cost of production encompasses all expenses incurred in manufacturing and selling a product, including manufacturing costs, logistics, selling expenses, and taxes.
On the other hand, market pricing is influenced by consumer behavior. In price-sensitive markets, consumers are less likely to purchase a product if its price is too high. Instead, they may opt for more affordable alternatives or even reconsider whether the product fits into their lifestyle. Conversely, in price-insensitive markets, consumers are willing to pay a premium if they perceive value in the product. For companies, the ultimate goal is to maximize profits, and they may adjust their pricing strategies to achieve this objective. They may set different prices for the same product in various markets. However, consumers are savvy and can take advantage of these price differentials. They may buy the product where it is cheaper and sell it in a more expensive market, effectively nullifying the company’s pricing advantage. Therefore, when setting prices, there’s always a trade-off between the effects of price sensitivity of the market and the potential for arbitrage opportunities.
To understand the impact these factors have on prices, we embarked on a journey to collect and compare prices of various digital products across multiple countries. This process necessitates the careful selection of products as we aim to create a diverse and equitable basket of goods that mirrors our digital landscape and provides valuable insights into the intriguing world of digital product pricing. In doing so, we can better understand how global economic factors and consumer behaviours shape the prices we pay for our favourite digital devices, software, and content.
Digital Basket
We focused on two key criteria when choosing products for our basket: representation and availability.
“Representation” means that the selected products should accurately represent the wide range of digital goods used in our daily lives. We want our basket to mirror the diversity of digital products we encounter.
“Availability” ensures that the products we’ve chosen are accessible to people all around the world and offer similar features and functionalities. This helps us maintain a fair comparison.
Following these principles, we’ve categorized the products into three main groups: Devices, Software, and Content. Each of these categories represents a distinct aspect of our digital experiences.
Devices
This category includes essential gadgets like mobile phones, laptops, and gaming consoles like the PlayStation and Xbox. These devices act as our gateways to the digital realm, allowing us to connect, work, and play. They are the tools that transport us into the vast world of technology.
Software
In our digital age, software plays a pivotal role in enhancing our productivity. Our chosen software products include Microsoft Office, Adobe Creative Suite, and iCloud. These applications empower us to create, communicate, and collaborate more efficiently. Whether it’s crafting documents, designing graphics, or managing emails, software forms the backbone of our digital workspaces.
Content
This category caters to our entertainment needs. It consists of platforms like Netflix, Amazon Prime, Spotify, YouTube, and Apple Music. These services provide us with a treasure trove of movies, music, videos, and more. What sets content apart from software is its primary purpose – consumption. While software helps us get things done, content is all about relaxation and enjoyment.
Head over to the Annexure to see the list of all products in our basket.
Studying the Pricing Disparity in Each Segment
Price Disparity – Devices
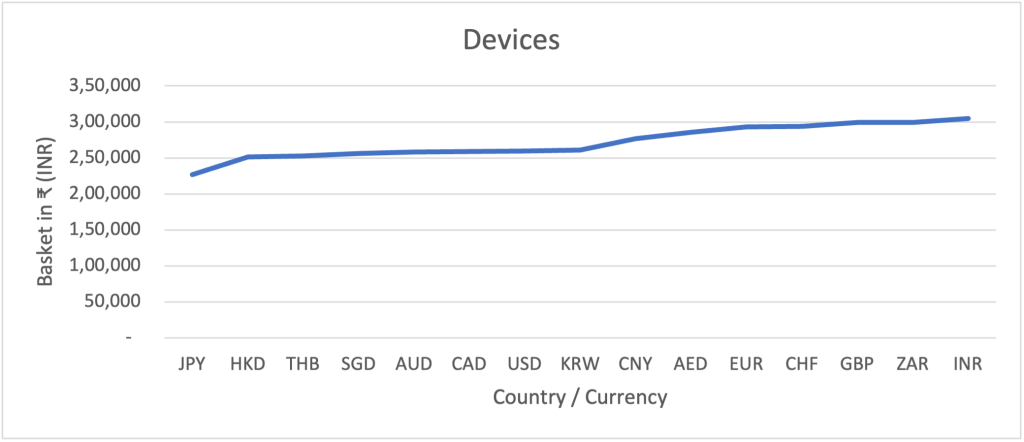
Our basket features must-have devices like the iPhone, MacBook, Play Station, and Xbox. Surprisingly, the cost of owning this tech treasure trove doesn’t vary much from one country to another. For instance, in Japan, the basket’s price tag hovers around ₹2.3 lakhs, while in India, it touches ₹3 lakhs. Although this may seem like a noticeable difference, the effect of price disparity in the device category remains relatively limited at a 34% increase from the cheapest to the most expensive country. Compare this to the disparity of 70% in the overall basket.
The production costs of devices are remarkably consistent globally, thanks to the efficient use of global supply chains by tech giants. However, market pricing reveals an interesting facet. While some markets may be more price-sensitive than others, these companies find it challenging to exercise significant price differentials due to a glaring arbitrage opportunity. The portability of these devices allows individuals to purchase them in countries like Japan, Hong Kong, or Thailand and resell them in India’s grey market at a lower price. In response, companies tend to maintain similar pricing levels across the globe to deter such activities.
Price Disparity – Software
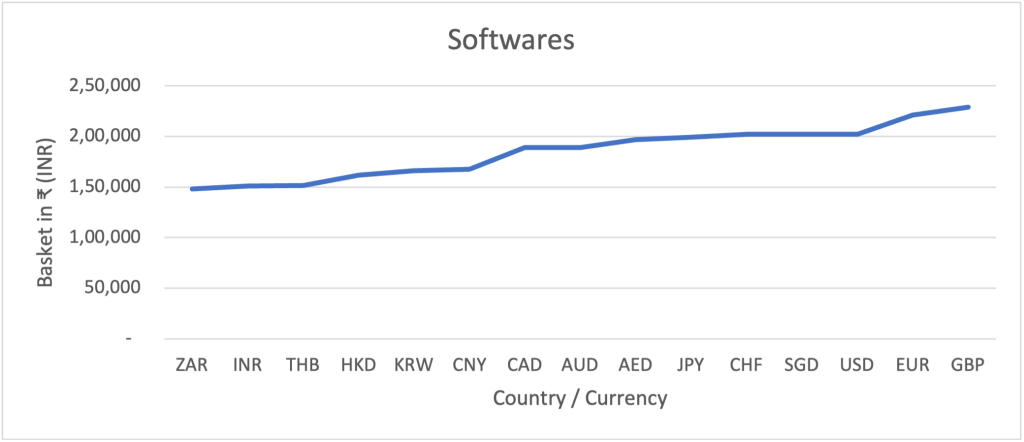
Our software segment encompasses three years’ worth of subscriptions to Adobe Creative Suite, Microsoft 365, and iCloud. Here, the price disparity is more pronounced, with South Africa offering the basket at ₹1.5 lakhs, while the same bundle costs ₹2.3 lakhs in the UK. The impact of this disparity stands at a noteworthy 55%.
Similar to devices, the cost of producing software remains consistent across the globe. These software packages are crafted at company headquarters and distributed digitally worldwide. Market pricing, however, presents a different scenario. The limited portability of software, enforced by digital distribution and IP address restrictions, enables companies to adapt pricing strategies that cater to varying consumer sensitivities. Consequently, these products are priced lower in emerging economies like South Africa, India, and Thailand, while prices soar in developed economies like the US, UK, and Europe.
Price Disparity – Content

Our final category delves into the world of content subscriptions, including Netflix, Disney+, YouTube, Spotify, and Apple Music. Remarkably, the cost of accessing these platforms differs significantly, with a 7x price differential between the most expensive market (Switzerland) and the cheapest (India). ₹50k in India compared to roughly ₹3.5 lakhs in Switzerland.
Content introduces unique dynamics into the pricing equation. Unlike devices or software, a substantial amount of content is produced locally, leading to varying production costs across countries. Additionally, like software, content’s distribution via the internet restricts portability, preventing customers from subscribing to services outside their regions. This distribution barrier empowers companies to further increase price disparities.
Conclusion
In closing, our journey through the world of digital products has unveiled a rich tapestry of price disparities, shaped by production costs and market pricing, reveal intriguing insights. While devices exhibit moderate variations in pricing across countries, software demonstrates more pronounced differences. Content, on the other hand, presents the most striking contrast, with prices ranging from a fraction of a lakh in India to several lakhs in Switzerland. This global interplay of factors highlights the intricate web that determines what we pay for our digital experiences. In this interconnected world, local contexts still profoundly impact our digital wallets.
Annexure
Devices
- iPhone 15
- Macbook Air – Apple M2 256GB Storage
- Play Station 5 – Disk Version
- XBOX Series X
Software
- Adobe CC Subscription- Adobe CC All Apps Annual Plan Monthly Payment
- Microsoft 365 Subscription – Microsoft 365 Personal Annual Plan
- Apple iCloud Subscription – 50GB Storage Monthly Plan
Content
- Netflix – Premium Plan per month
- Amazon Prime – monthly Subscription
- Disney + – Monthly Subscription
- YouTube Premium – YouTube Premium with YT music
- Spotify – Individual plan for 1 month
- Apple Music – Individual for 1 month
The reason behind selecting these products for our basket is simple. They represent the core elements of our digital lifestyle, encompassing the tools we use to connect (Devices), work (Software) and the sources of entertainment that enrich our leisure time (Content). By monitoring the prices of these products across different countries, we gained valuable insights into how purchasing power varies globally, and how it impacts our ability to access and enjoy the digital world.
