For those of us who grew up in the 90s, Sachin Tendulkar wasn’t just a cricketer; he was a national event. Every time he walked out to bat, the world seemed to stop. His centuries weren’t just numbers on a scoreboard; they were markers of our own childhoods, moments of collective joy that taught an entire generation what it felt like to witness greatness.
Years later, I wanted to preserve those memories and create a tribute to this legend. To honor all 100 centuries, I turned to AI, exploring its API capabilities for large-scale content generation rather than using it as just helpful chat. The result is LittleMaster100.wordpress.com — a complete cricket blog celebrating each of Sachin’s 100 centuries with unique articles and custom AI-generated illustrations. This demonstrates how AI can transform raw cricket statistics into a complete multimedia storytelling website celebrating Sachin’s legendary career.
My Journey Through the Code
I built the entire website using a three-phase automation pipeline in Python. It was a fascinating challenge, and if you’re curious about the nuts and bolts, the complete source code is available on my [GitHub](https://github.com/hiteshgulati/LittleMaster100).
Here’s how I structured the process:
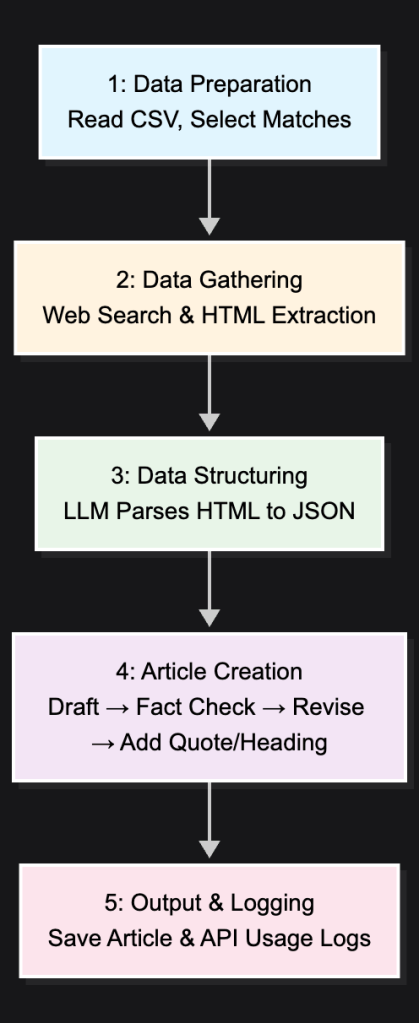
Phase 1: Writing the Stories — I fed the AI the basic match data from an Excel file. Its first job was to act like a sports journalist, searching the web for scorecards and old commentary. Then, it got creative, writing an emotional story for each match in the style of a famous author. To keep it honest, I even built in a fact-checking step.
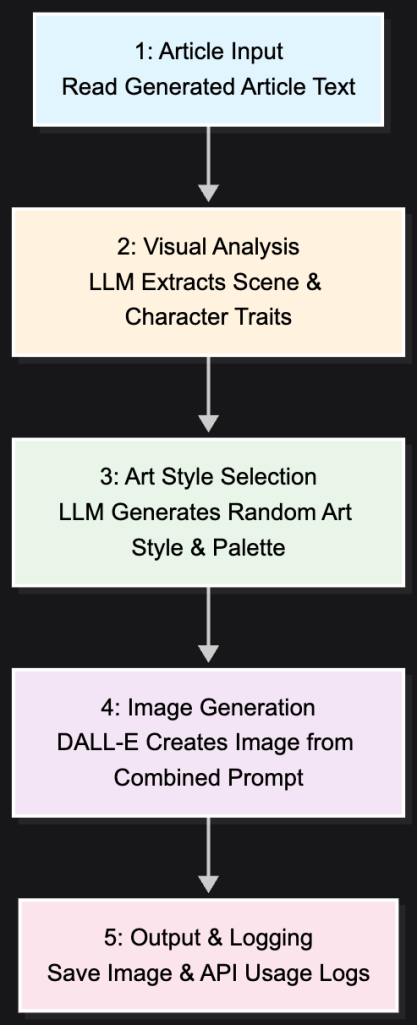
Phase 2: Creating the Art — For each article, I had the AI act as an art director. It would read the story it just wrote, extract the core emotion, and then generate a unique illustration using DALL-E. I programmed it to use different art styles and colors to give each memory its own visual identity.
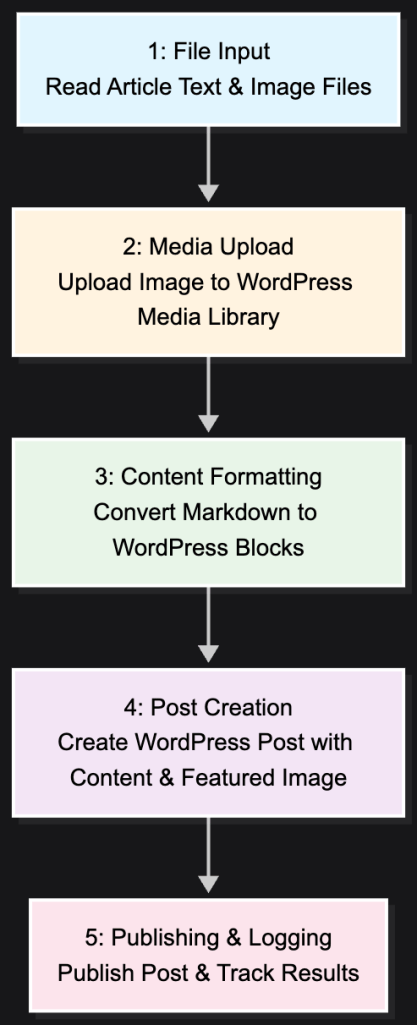
Phase 3: Publishing the Blog — Finally, a script takes the finished text and its corresponding image and automatically publishes them to the WordPress blog, complete with the proper formatting and a featured image.
The Economist
Cost of AI Content Creation
Phase
Time
Total Time (100 articles)
API Cost (per article)
Total Cost (100 articles)
APIs
Article Generation
~2 minutes
~3.5 hours
~$0.06
~$6.00
Tavily + OpenAI
Image Generation
~1 minute
~1.5 hours
~$0.04
~$4.00
OpenAI + DALL-E
WordPress Publishing
~30 seconds
~50 minutes
–
–
WordPress API
Total
~3.5 minutes
~5 hours, 50 minutes
~$0.10
~$10.00
Two things stand out:
Time: What would have taken months of manual work was finished in under six hours.
Cost: The entire project, a 100-article multimedia blog, cost just $10.
It’s a powerful illustration of how AI can bring large-scale creative projects within anyone’s reach.
My Takeaways
This project was a personal exploration of AI’s potential to be more than just a productivity tool. It can be a partner in creativity.
The results aren’t perfect. Some of the AI’s prose is a bit generic, and some of the images it created are, frankly, hilarious — more comic than inspiring. But that’s part of the journey. What started as a simple CSV file became a living website with 100 distinct memories, all brought to life with minimal human intervention.
For me, this proves something incredible: the entire content pipeline — from research and writing to visual design and publishing — can now be automated. It shows that we’re at a point where anyone can create comprehensive, professional-quality content. It’s a democratizing force for storytelling.
Ultimately, this was my way of saying thank you to a childhood hero. I hope you enjoy reliving the memories.
Attribution modeling helps businesses understand which marketing channels and customer touchpoints drive conversions. By accurately assigning credit to different interactions along the customer journey, companies can optimize marketing spend, improve ROI, and make data-driven decisions about their customer acquisition strategy.
Attribution Models
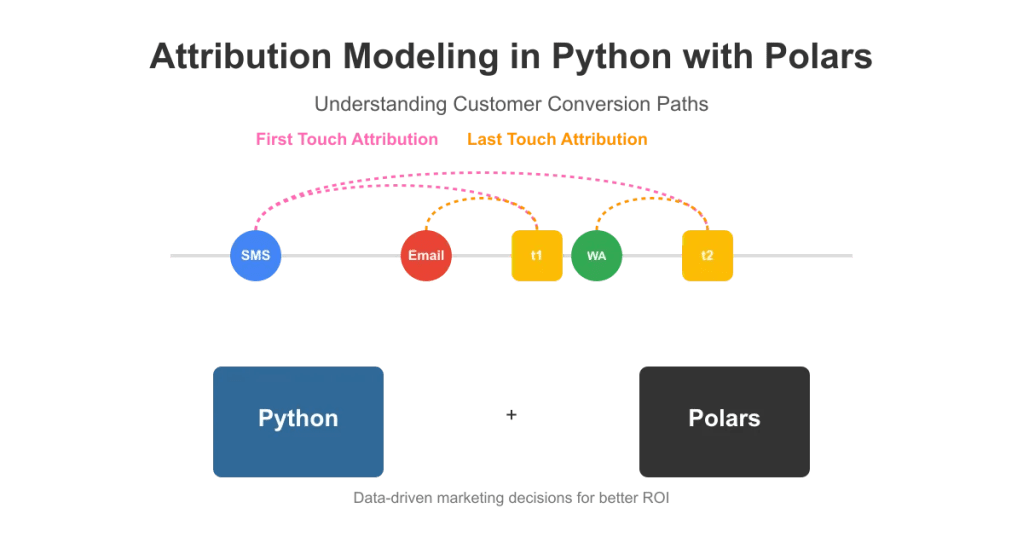
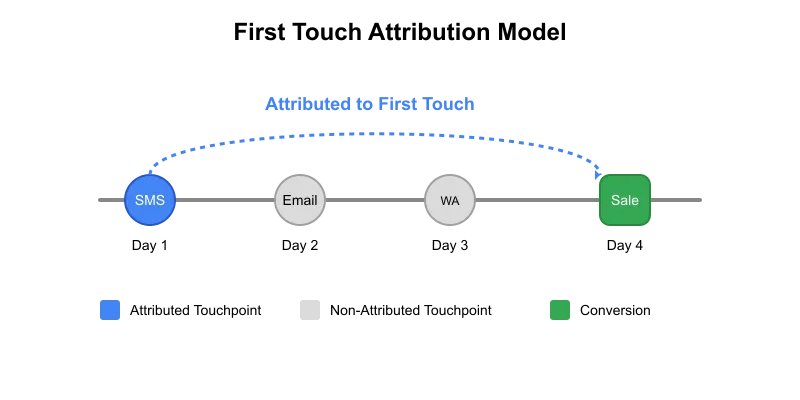
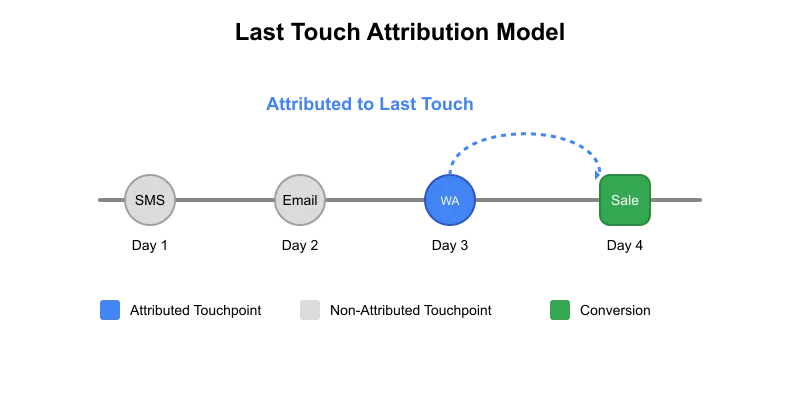
In this article, we’ll implement a simple yet powerful attribution model using Python and Polars. We’ll focus on two fundamental approaches: first-touch attribution, which assigns conversion credit to the initial customer interaction, and last-touch attribution, which credits the final touchpoint before conversion.
Conceptual Understanding
Let’s start with an example. An ecommerce company wants its users to complete transactions on its website. It runs campaigns targeting customers via SMS, WhatsApp, and email, requesting them to take action on the platform (in this case, making a transaction). All the requests or call-to-action communications sent to the customers are stored in a table. We name this table as call to action table or briefly CTA table. A sample version of the table would be:
| custID | channel | message      | timestamp  |
|--------|---------|--------------|------------|
| C1     | SMS     | Get 5% off   | 2025-04-01 |
| C1     | eMail   | Get 10% off  | 2025-04-05 |
| C1     | WhatsApp| Get 3% off   | 2025-04-07 |
Next, we have a table which stores all the actions or transactions performed by the customers. We’ll name this table as action table. Such a table would look like:
We sent three different calls to action (CTAs) to the customer, and in return, they performed two transactions. We want to see how effective these CTAs were. Based on the first touch attribution, both transactions can be attributed to SMS as that was the first communication sent to the customer. However, if we use the last touch method, transaction t1 will be attributed to email while transaction t2 will be attributed to WhatsApp.
The inner join operation in the first step creates duplicate action rows. We’ll need to remove the duplicate rows and keep only the attributed rows. The rows which will be kept depends on the type of attribution we need to apply.
First touch attribution: We’ll keep the earliest records based on cta_timestamp and then remove all other duplicate rows.
Last touch attribution: We’ll keep the latest records based on cta_timestamp and remove remaining.
# First Touch Attribution
result_df = (
    action_table_attributed
    .sort("cta_timestamp")
    .unique(subset=["txn_ID"], keep="first")
    .sort("txn_ID")  # Optional: sort the results by txn_ID
)
# Last Touch Attribution
result_df = (
    action_table_attributed
    .sort("cta_timestamp")
    .unique(subset=["txn_ID"], keep="last")
    .sort("txn_ID")  # Optional: sort the results by txn_ID
)
First Touch Attributed
custID
txn_ID
amount
action_timestamp
channel
message
cta_timestamp
str
str
i64
datetime[μs]
str
str
datetime[μs]
C1
t1
250
2025-04-06 00:00:00
SMS
Get 5% off
2025-04-01 00:00:00
C1
t2
175
2025-04-08 00:00:00
SMS
Get 5% off
2025-04-01 00:00:00
Last Touch Attributed
custID
txn_ID
amount
action_timestamp
channel
message
cta_timestamp
str
str
i64
datetime[μs]
str
str
datetime[μs]
C1
t1
250
2025-04-06 00:00:00
eMail
Get 10% off
2025-04-05 00:00:00
C1
t2
175
2025-04-08 00:00:00
WhatsApp
Get 3% off
2025-04-07 00:00:00
Step 3: Unattributed Actions
Not all actions performed by customers will be attributed to a CTA. Get all unattributed actions:
The final table contains all the actions done by the customers. Along with that, it also has CTA columns. Any transaction not attributed to any CTA will have null values in the CTA columns. This attributed table is helpful as it filters out which CTA communications are best for conversions and which are not.
Business Value of Attribution Modeling
Attribution modeling provides invaluable insights that directly impact business performance. By accurately identifying which marketing channels drive conversions, companies can allocate budgets more efficiently, focusing resources on high-performing touchpoints. This targeted approach typically increases conversion rates by 15–25% while reducing customer acquisition costs. Additionally, attribution reveals the customer journey, helping marketers understand how different channels interact and complement each other. This knowledge enables the creation of more effective, multi-channel campaigns that meet customers at critical decision points. Ultimately, data-driven attribution transforms marketing from an expense into a strategic investment with measurable returns.
Conclusion
In conclusion, implementing attribution models with Python and Polars empowers businesses to move beyond guesswork in marketing decisions. This approach scales seamlessly with growing data volumes while providing the flexibility to adapt attribution rules as business needs evolve. Remember that attribution is not a one-time exercise but an ongoing process that should be continuously refined. As your understanding of customer behavior deepens, you can progress to more sophisticated models like time-decay or position-based attribution. By turning raw interaction data into actionable insights, you’ll not only improve marketing efficiency but also enhance the overall customer experience — creating a sustainable competitive advantage in today’s data-driven marketplace.